Estimating the Proportion 'p' to Start a Study
Choose an initial proportion for study planning and understand the limits of adapting the sample from a pilot.
Updated:
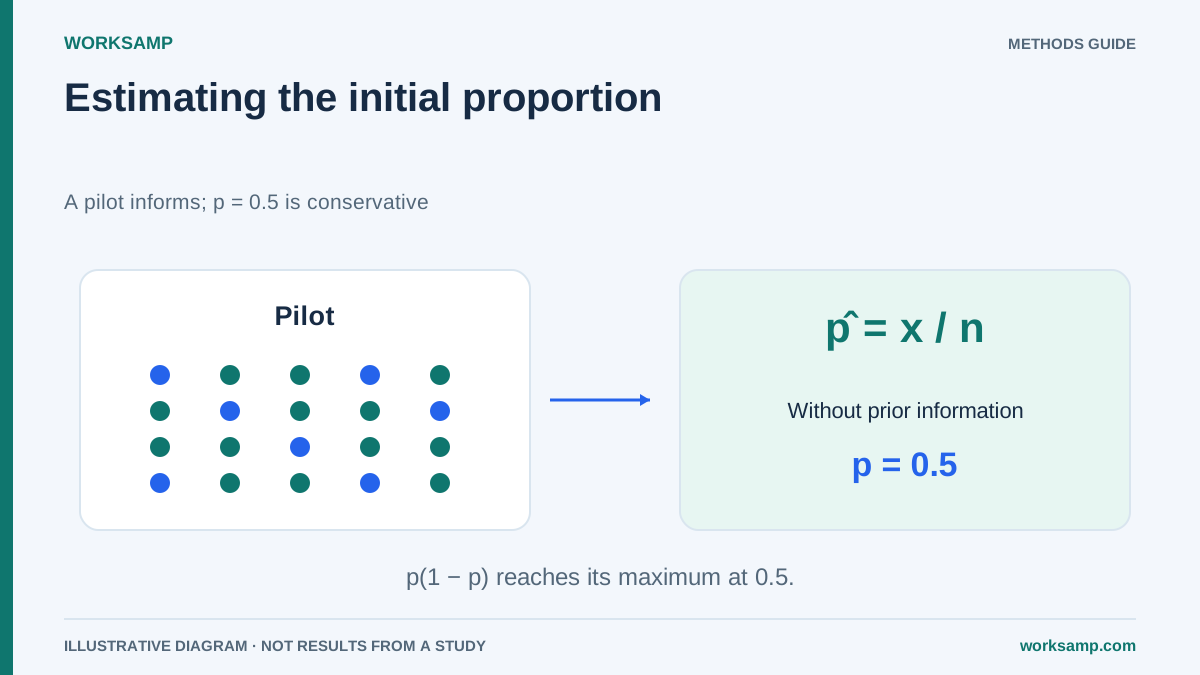
p₀ is a planning assumption for a defined category, not the final share or a worker-quality score. The observed estimate is p̂=x/n with compatible denominators and weights.
Formula and conservative choice
For a simple independent model, n₀=ceiling(z²p₀(1−p₀)/e²). e is a proportion: 0.05 means five percentage points. p₀=0.5 maximises p₀(1−p₀) and is a reasonable starting choice when information is insufficient. It does not repair bias or dependence or guarantee coverage.
| p₀ | n₀ at two-sided 95% and five points |
|---|---|
| 0.50 | 385 |
| 0.40 | 369 |
| 0.30 | 323 |
| 0.20 | 246 |
| 0.10 | 139 |
| 0.05 | 73 |
The table uses z=1.96 and upward rounding. Small rows do not establish reliable precision for every rare event: check approximation, interval and relative objectives.
A useful pilot
Define categories, eligible periods, coverage and omission rules. Observe relevant conditions and estimate p̂. No universal fifty-reading minimum stabilises every proportion. A small pilot may miss important events or yield p̂=0 or 1 without proving impossibility.
Document any adaptive sample-size rule and its uncertainty. Do not treat pilot p̂ as known truth. Use conservative assumptions and sensitivity analysis where appropriate; include pilot data only under a compatible protocol.
Judgment and references
Experienced staff can clarify categories and constraints, but opinions are not a probability sample. Do not multiply p by 0.85 as a “conservative correction”: moving p toward 0.5 can increase n and moving away can reduce it. Conservatism concerns p(1−p), not always lowering p.
There is no universal 45–65% direct-work benchmark for every plant. Check source, categories, denominator, period and context. Unsupported figures should be explicit sensitivity scenarios, not sector facts.
Calculated example
With p₀=0.2, five points and 95%, n₀=246 compared with 385 at p₀=0.5. The arithmetic difference is about 56.5% more records relative to 246; it does not prove unnecessary cost. A conservative choice may be justified when 0.2 is uncertain.
For relative precision r, e=r p₀ and the formula becomes n₀≈z²(1−p₀)/(r²p₀). Low p may then need many more readings. Lower n at fixed absolute error does not mean rare events are easy to estimate relatively.
In Worksamp
Documented planning uses the observed proportion from twenty visits and bounds it to 0.05–0.95. This product rule is not proof that twenty visits guarantee stability. Check coverage and design reliability and interpret results using analysis intervals.
Sources: NIST sample size, NIST proportions. Worksamp.