P-Charts (Control Charts) for Analysts
Interpret p-charts without confusing control limits, confidence intervals and guarantees of study validity.
Updated:
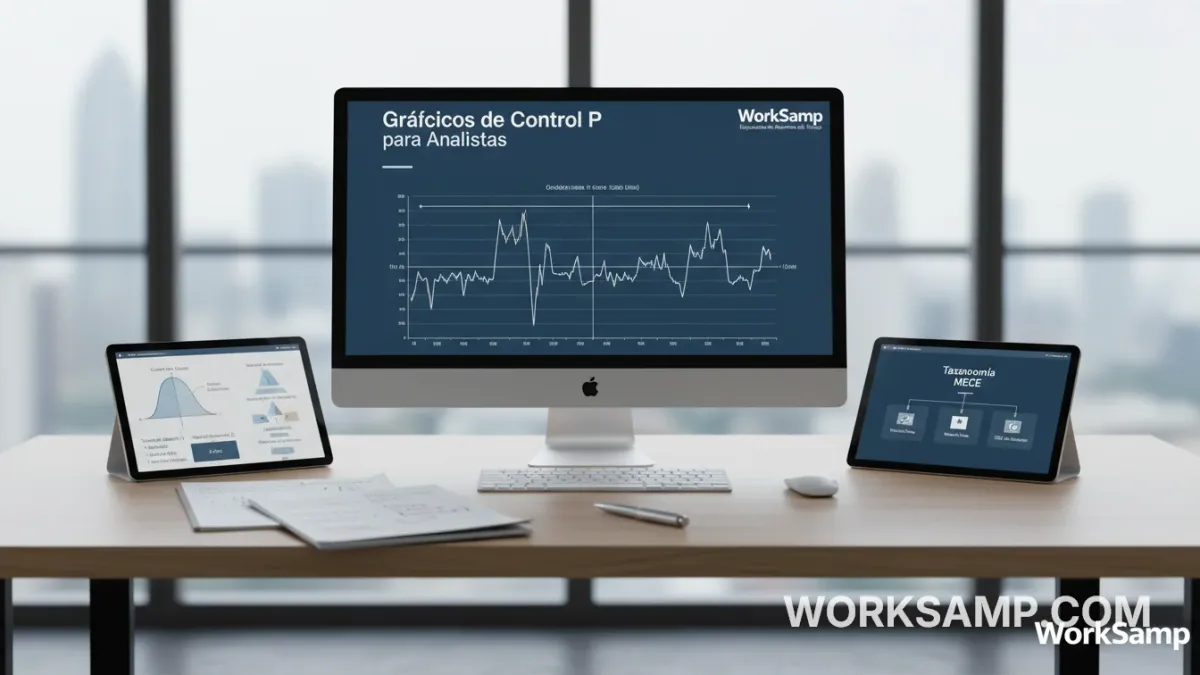
A p-chart follows a proportion across successive subgroups. It can flag changes for investigation; it does not establish their cause, prove stability on its own or assign responsibility to workers.
Model and subgroups
Define a binary event per record, such as a machine waiting for material within planned time. A reading is Bernoulli; its count is binomial under independence and a common probability. With several categories, analyse each defined event and consider multiple testing.
Use comparable rational subgroups. Product, shift, sample or weighting changes may require separation. Multiple people in a round do not automatically provide independent observations.
Centre line and limits
For subgroup i, p̂ᵢ=xᵢ/nᵢ. The pooled centre line is p̄=Σxᵢ/Σnᵢ, not an unweighted mean of percentages with different denominators.
UCLᵢ=min(1,p̄+3√[p̄(1−p̄)/nᵢ])LCLᵢ=max(0,p̄−3√[p̄(1−p̄)/nᵢ])
These are approximate control limits, not a mean-confidence interval or specification limits. Varying nᵢ changes them. Extremes or small counts require appropriate alternatives; n>30 alone does not validate normal approximation.
Simulated example
With reference p=0.65 and n=300, model standard deviation is 0.02754. Approximate limits are 0.5674 and 0.7326. A day at p̂=0.50 warrants investigation under that model.
It does not mean “under 0.3% probability this is chance” or prove material shortage. The reference may be estimated, observations correlated and rules subject to false alarms. A teaching case may assume process records confirm a shortage, explicitly identifying that additional evidence as the causal source.
Patterns and familiarisation
Points inside limits do not establish stability. Assess trends and prespecified run rules, including false-alarm risk. Initially high values do not diagnose a Hawthorne effect; load, product, observer or classification may have changed.
Do not discard initial days just to make a stable baseline. Predefine familiarisation, retain traceability and justify exclusions.
Decisions and tools
Investigate signals before intervening. Do not label people or assume 94% of problems are invariably systemic. Historical quotations do not replace process evidence.
Worksamp supports activity capture and distribution analysis. External p-chart or SPC analysis requires checking available functions, denominators and assumptions. Do not claim an undocumented certified SPC dashboard.
OEE needs counts and ideal cycle time in addition to states. An activity p-chart does not automatically provide all three factors. Aggregating people does not guarantee anonymity or GDPR compliance.
Sources: NIST proportion charts, GDPR. See Worksamp for capture functionality.