What is a Confidence Interval and why does your Plant need it?
Interpret a confidence interval and communicate uncertainty without assigning probabilities to the fixed parameter.
Updated:
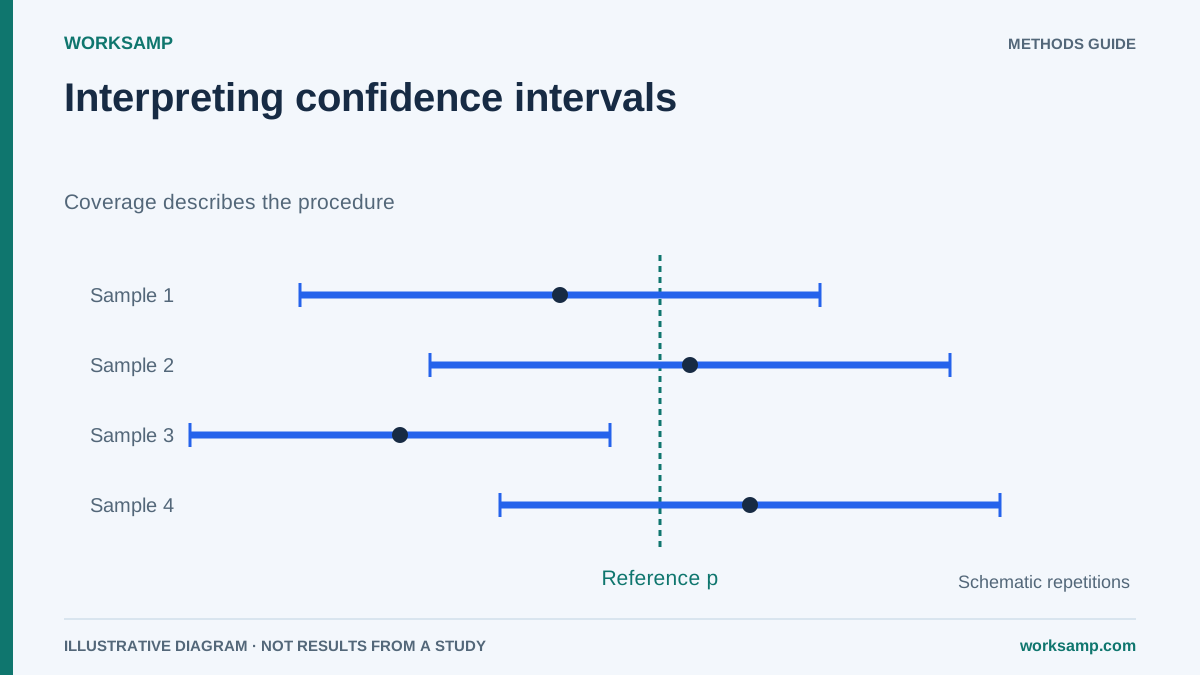
A sample percentage is an estimate. Its interval expresses sampling uncertainty under a procedure and assumptions; it does not protect against every classification, coverage or selection error.
What 95% means
If the design were repeated under the same conditions and intervals calculated by the same method, approximately 95% would contain the fixed population proportion when nominal coverage is achieved. After one interval is observed, frequentist interpretation does not assign 95% probability to the parameter.
Confidence is not total decision risk, the probability each record is correct or productivity certification. Choose confidence and precision according to consequences and resources; no universal 99% requirement applies to investment or closure decisions.
Formula and planning
For independent Bernoulli observations and an adequate normal approximation:
p̂=x/n; SE=√[p̂(1−p̂)/n]; approximate CI=p̂±z SE
The margin is half-width; total width is twice the margin. Five percentage points is not 5% relative error for every proportion.
Simple planning is n=ceiling[z²p₀(1−p₀)/e²]. With p₀=0.5:
| Absolute target margin | 95%, z=1.96 | 99%, z=2.576 |
|---|---|---|
| 5 points | 385 | 664 |
| 3 points | 1,068 | 1,844 |
| 1 point | 9,604 | 16,590 |
At the same margin, greater confidence requires more records. It does not ensure representativeness or independently define power for comparing periods.
Simulated example: a 60% threshold
There are 210 direct-work records among 400: p̂=52.5%. The approximate normal 95% interval is 47.6–57.4%; Wilson is approximately 47.6–57.3%.
For a descriptive threshold of 60%, the whole interval is below it. The design supports a proportion below the threshold; it is incorrect to say the wide interval prevents that conclusion. Nevertheless, 60% may be an inappropriate objective if setup and support are necessary. Decisions require causes, quality, capacity, cost and context.
For 300/400=75%, the approximate normal 95% margin is 4.2 points, not three. These are different examples and should not be mixed.
Changes and targets
For two large independent campaigns, estimate Δ=p̂₁−p̂₀ with SE(Δ)=√[p̂₀(1−p̂₀)/n₀+p̂₁(1−p̂₁)/n₁]. Check whether its interval excludes zero and whether the effect matters practically. Overlap of individual intervals does not prove equality.
Do not target only a higher lower bound: it can rise simply because n increases without operational change. A past interval is not a control or acceptance limit for future campaigns.
When to adapt the method
Few events, extreme proportions, clusters, weighting or repeated observations may invalidate the simple formula. Wilson is a proportion interval, not a transformation fixing every issue. Expected-count rules guide approximation rather than guarantee validity.
A round observing several people produces potentially correlated participations. Randomisation does not ensure independence, and a large sample does not repair missing shifts. Do not remove the first 24–48 hours because percentages rise or fall: mix or demand may explain trends, not just reactivity.
Responsible use
WorkSamp supports observation planning and recording; interpret calculations according to design. Active-person share is not OEE, which needs time data, ideal cycle time and total/good units. A CI certifies neither legal compliance nor safe staffing.
Present estimate, interval, n, coverage, method, assumptions and limitations alongside the recommendation.