Work Sampling KPIs for Industrial Dashboards
Present proportions, coverage and uncertainty in a dashboard without treating them as direct productivity measures.
Updated:
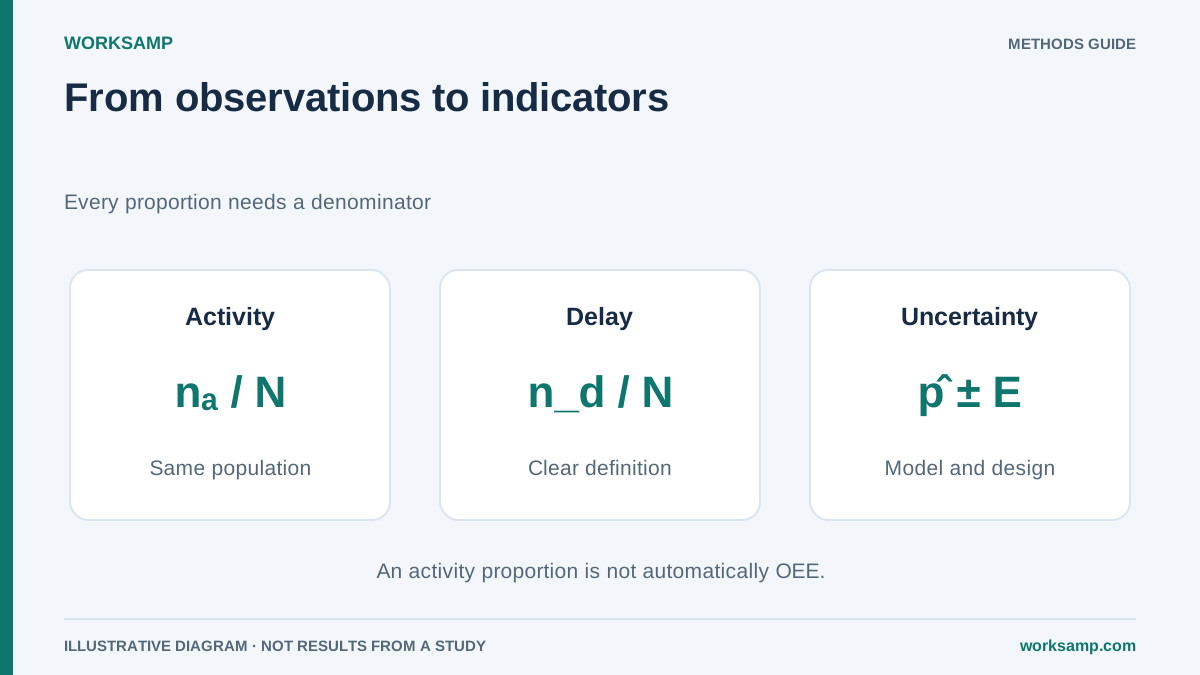
A dashboard needs indicators with a defined population, denominator, period and method. Sampling provides proportions and uncertainty; converting them to hours, costs or decisions requires more information. A narrower interval means greater model-based precision, not improved operations.
1. Activity and utilisation
If xᵢ are counts and n is the valid total:
Direct-work proportion = Σxᵢ_direct / n
If pᵢ are already proportions, add them without dividing by n again. The complement includes support, breaks and waiting; it is not all avoidable unproductivity.
For machines, utilisation = running time / reference time. State whether the denominator is calendar time, scheduled time or planned production time. Excluding a state requires consistent numerator and denominator treatment and a justified definition. Changeovers within planned production do not disappear merely because they were anticipated.
OEE is a different measure: availability × performance × quality. It requires ideal cycle time and total and good units as well as time data. It is not the proportion of active people.
2. Hours and financial valuation
Using a compatible H:
Equivalent category hours = p̂ × H
Labour-cost equivalent = p̂ × H × hourly cost
Simulated example: 50 people × 8 h × 220 days = 88,000 person-hours. An 18% state corresponds to 15,840 h and, at €22/h, €348,480. This values time; it is not demonstrated cash savings or incremental cost.
For potential production, verify the bottleneck, demand, performance, quality and contribution margin. A machine with 3,600 h, 12% downtime, 200 units/h and €4.80/unit contribution has a hypothetical maximum of €414,720 extra contribution if all that capacity becomes good units sold. Do not automatically add labour already included in the margin, which would double count costs.
3. Indicator precision
Under independent Bernoulli records:
SE(p̂) = √[p̂(1−p̂)/n]
The approximate normal 95% interval is p̂ ± 1.96 SE; total width is 2×1.96 SE. Wilson may be preferable, especially near extremes. Dependence, strata and weights require adapted calculations.
Compare periods by analysing the difference; overlap of individual intervals does not establish no change. For large independent samples, SE(Δ)=√(SE₀²+SE₁²). A two-point drop is not universally significant.
SE/p̂ expresses relative standard error when p̂>0, but a 2% or 5% threshold must follow decision needs rather than a supposed industrial rule.
4. Balance and flow
One descriptive index is (maximum−minimum)/mean of comparable proportions. It has no universal bottleneck thresholds. A station's higher direct-work share does not establish that it constrains throughput: investigate cycles, queues, blocking, starvation and system output.
A weighted average of proportions × cycle times is not the line's actual cycle. Measure output using compatible operating time divided by units, or departure timestamps for interdeparture times.
Simulated machining case
Assume 15 people on each of two shifts, eight hours and fifteen days: H=15×2×8×15=3,600 person-hours. If fifteen people are the total across shifts, H is 1,800; the number of shifts does not double people.
A study of 4,200 participations has these shares:
| Category | Proportion |
|---|---|
| Direct machining | 28% |
| Adjustment defined as direct | 9% |
| Inspection defined as direct | 11% |
| Material waiting | 16% |
| Machine waiting | 13% |
| Setup | 8% |
| Rework | 7% |
| Other | 8% |
The defined direct total is 48%, with 52% remaining. At €22/h, the remainder represents €41,184 of time over the period. Extrapolating to 220 days assumes stable mix and calendar, not a verified savings budget.
If a later campaign estimates 61% direct, the difference is 13 points. On 52,800 annual person-hours at €22/h, the equivalent is €151,008. Check uncertainty, comparability and use of that capacity before calling it a benefit.
Dashboard design
Show the indicator, time base, n, coverage, interval, category version and pending action. Prioritise direct work, verified waits, quality and throughput. Traffic lights need agreed objectives and context; avoid universal monetary limits or rating individuals from an aggregate sample.
WorkSamp supports planning and observation recording; an integrated module for all these KPIs is not assumed.