OEE Measurement Using Work Sampling
What sampling contributes to OEE analysis and the additional data needed for availability, performance and quality.
Updated:
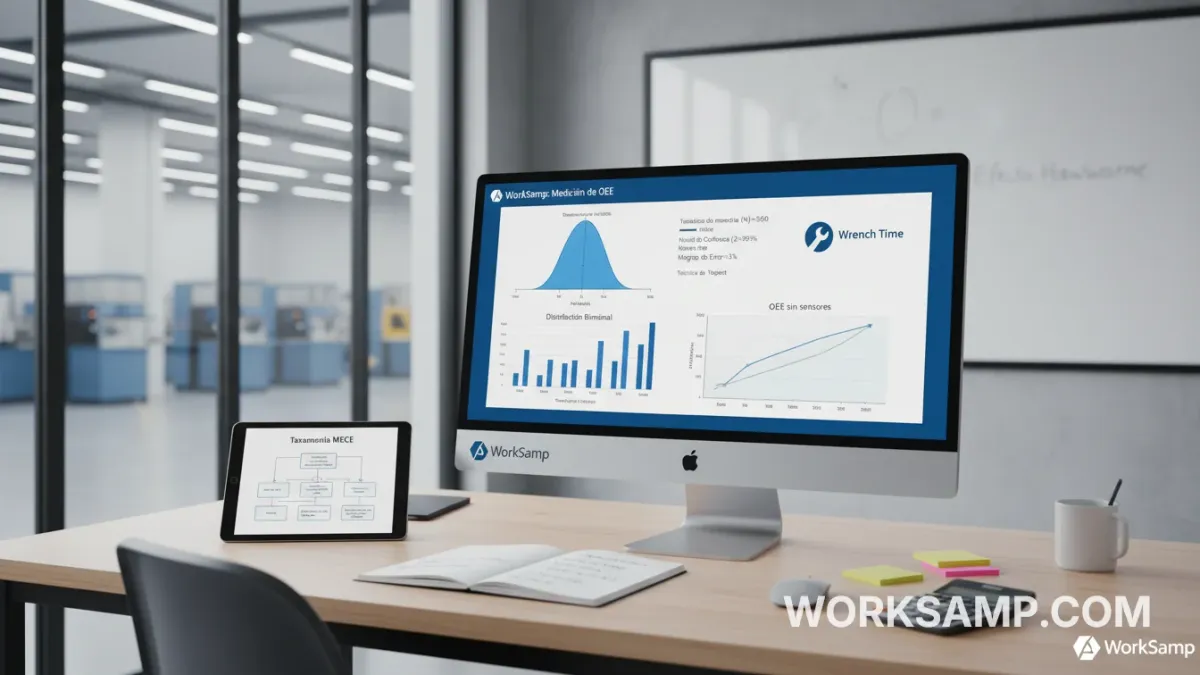
OEE describes equipment losses against planned production, ideal cycle time and first-pass quality. Sampling describes observed states. They can complement each other but are not the same metric, and neither universally outperforms sensors, production records or stopwatch study.
Compatible reconstruction
Use A=run time/planned time; P=ideal cycle×total count/run time; Q=first-pass good count/total count; OEE=A×P×Q. Denominators and periods must match. A planned stop inside scheduled production is not excluded merely because it was known beforehand.
Temporal sampling may support A. P needs counts and ideal cycle time, not visual pace rating. Q needs inspected units and a conformance definition, not rework-activity frequency. Inspection activity does not establish product quality.
Useful study categories
Define running, setup, breakdown, confirmed waiting and other states. Use subcategories to investigate causes without inferring them from an absent operator. Separate equipment and people: an automatic machine can produce while its operator does another task.
Represent planned time and record actual observation time. A reading does not time every microstop. It may estimate occupancy if selection and classification are appropriate, not event frequency or duration.
Precision and confidence
The independent planning approximation is n₀=ceiling(z²p₀(1−p₀)/e²). At two-sided 95%, p₀=0.5 and e=0.03, it gives 1,068. Confidence is not an accuracy percentage and does not guarantee detection, audit acceptance or safety validation.
The law of large numbers concerns estimator convergence under conditions; the central limit theorem concerns an approximate normal sampling distribution under assumptions. Categorical readings do not become normal. Nor are 2,000 observations invariably better than SCADA: either source may have bias, errors and different coverage.
Simulated example
A machine has 600 planned minutes. Records give 500 running minutes, a 0.4-minute ideal cycle, 1,000 total parts and 960 first-pass good parts. A=83.33%, P=80%, Q=96%, OEE=64%. The direct calculation 960×0.4/600 also gives 64%.
If running time is estimated from sampling, report A's interval and the sources of counts and cycle time. Do not assign that single proportion's exact margin to the combined OEE.
Energy and economics
OEE=45% does not mean unproductive energy consumption for 55% of time: the indicator combines availability, speed and quality. Energy assessment needs measured or verified power by state, duration and output. Matching sampled states to a theoretical curve does not establish entitlement to grants or PERTE funding.
Do not promise zero CAPEX, free licences or fixed payback. Include observers, devices, training, software, data work and implementation. Cash savings do not automatically equal estimated hours times a rate.
Use and limits
Worksamp supports activity planning, capture and analysis. A website calculator is not proof of an integrated OEE module. Working-time records and standard-time studies answer other questions. Explain the study and assess privacy: aggregate results do not guarantee anonymity or compliance.
See Worksamp for supported workflows. Grant, audit and contractual requirements need their own assessment.