Work Sampling for SMEs: A Practical Guide
Prepare a work sampling study in a small business: scope, categories, observations, interpretation and follow-up decisions.
Updated:
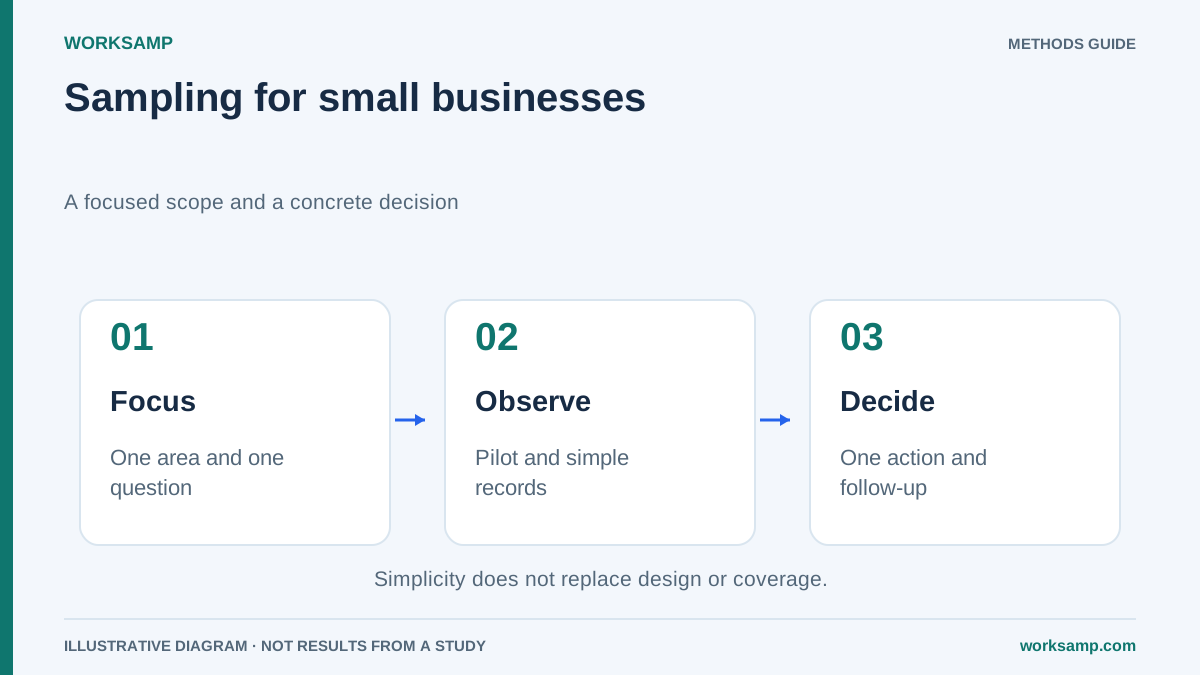
An SME can investigate time distribution without installing sensors at every workstation. Work sampling uses instantaneous observations to estimate activity proportions. Its suitability depends on the decision, safe access and the cost of collecting sufficient data: paper and spreadsheets do not make staff time free.
Start with a decision
Choose a defined cell, shift or process, such as investigating material waits before adding staff. Direct-work share is not total productivity: orders, quality, hours and constraints also matter. For the seconds required by a specific operation, use a complementary time study.
Four to six categories may be enough if they answer the question:
| Category | Classification rule |
|---|---|
| Direct work | Performing the defined operation |
| Preparation and support | Setup, necessary cleaning, coordination |
| Material waiting | Confirmed lack of material |
| Equipment waiting | Technical resource unavailable |
| Transport | Separate necessary and avoidable movement if relevant |
| Breaks and other | Separate these when required by the decision |
Document borderline cases and train observers. Do not classify all support or breaks as waste.
Plan sample size and effort separately
Under independent Bernoulli observations and an adequate normal approximation:
n = ceiling[z²p₀(1−p₀)/e²]
With z=1.96 and p₀=0.5:
| Absolute target margin | Planned records |
|---|---|
| 10 percentage points | 97 |
| 7 points | 196 |
| 5 points | 385 |
| 3 points | 1,068 |
| 1 point | 9,604 |
Seven points may suit some decisions and be insufficient for others. There is no universal SME precision.
A round observing 15 people produces up to 15 participations, not 15 independent visits. Four daily rounds have four starting instants; correlation between people and route effects can reduce independent information. Do not infer study duration simply by dividing 196 by 60 daily records.
Distribute observations across represented conditions. Do not replace a missed night round with a convenient morning one without reviewing coverage and weights.
Keep collection and analysis manageable
A template should include planned and actual time, observed unit, category, observer and incidents. Generate random schedules, retain the plan and record missing observations. Rotating observers shares effort but requires consistent criteria and does not eliminate observer reactivity.
A teaching example has 250 records: 145 direct work, 30 preparation, 42 waiting, 18 transport, 12 breaks and 3 other. They sum to 250; direct work is 58%. Its approximate normal 95% margin is 6.1 percentage points under the simple model. For rare categories and to avoid negative bounds, use an appropriate interval such as Wilson. A category's percentage alone does not establish savings potential: investigate necessity, causes and implementation cost.
A p-chart may support monitoring if subgroups and assumptions are appropriate. Its limits are neither targets nor individual confidence intervals; vary them with subgroup size and account for correlation.
Simulated case: 25 people
Assume a six-day campaign with 250 participations selected across people and times, not all 25 people in each of 60–72 rounds. Plan coverage of both shifts. The following percentages are rounded scenario assumptions, not exact frequencies of that sample:
| Activity | Before | Assumed after |
|---|---|---|
| Direct work | 54% | 71% |
| Preparation | 18% | 11% |
| Waiting | 14% | 6% |
| Transport | 9% | 7% |
| Breaks/other | 5% | 5% |
Preparing tools, reviewing replenishment and relocating equipment are intervention hypotheses. Preparation falls seven points, a 38.9% relative reduction; waiting falls eight, or 57.1%. These actions have not been shown to cause the change: comparative design, uncertainty and production conditions remain to be assessed.
Assuming 2,000 annual hours per person and €18/h, the additional 17 direct-work points correspond to 25 × 2,000 × 0.17 = 8,500 hours, valued at €153,000 in labour-cost equivalents. This is not proven added value, sales or cash savings. Deduct study and implementation costs and verify how capacity is used.
Tool and next step
WorkSamp supports observation planning and recording. Check current functions and terms without assuming a price or free trial. Select the question and design before selecting the tool.
Minimise personal identification and data access and assess the applicable legal basis. A process study does not automatically guarantee compliance or permit individual assessment from an aggregate.