Confidence Level: 95% or 99%?
Choose between 95% and 99% confidence while accounting for precision, cost and sampling-design assumptions.
Updated:
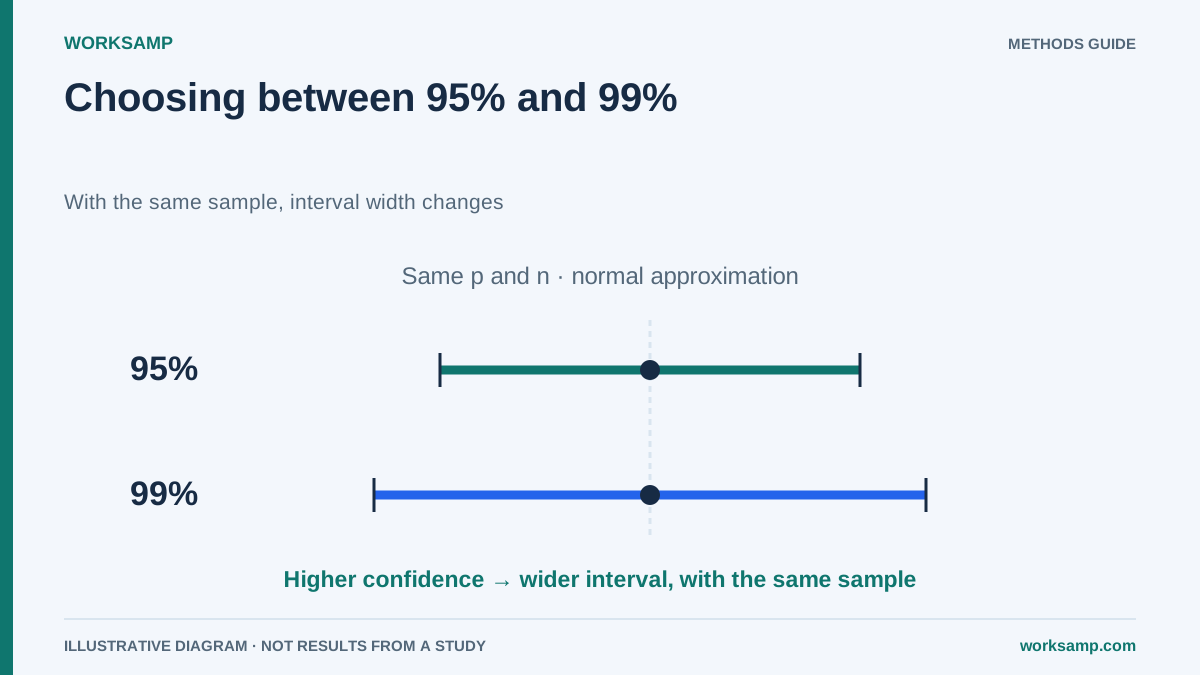
Confidence and precision are different parameters. With the same data, a 99% interval is generally wider than a 95% interval. Higher confidence neither makes biased selection representative nor validates safety.
Correct interpretation
Frequentist coverage concerns repeated sampling under the model: about 95% of intervals constructed by a 95% procedure would contain the fixed parameter. It is not 95 correct readings out of a hundred or a 95% probability that a point estimate is truth.
Confidence is also not comparison significance or power to detect a difference. Those related concepts need their own objectives and calculations.
z-values and initial size
For two-sided normal intervals, z≈1.96 at 95% and z≈2.576 at 99%. These are quantiles, not percentages. Under independent simple random sampling:n₀=ceiling(z²p₀(1−p₀)/e²).
| Confidence | p₀ | Absolute error | n₀ |
|---|---|---|---|
| 95% | 0.50 | 5 points | 385 |
| 99% | 0.50 | 5 points | 664 |
| 95% | 0.50 | 3 points | 1,068 |
| 99% | 0.50 | 3 points | 1,844 |
These planning calculations round upwards. Moving from 95% to 99% increases the unrounded requirement by about 73%. Reaching the record count is insufficient: coverage, weights, clustering and classification matter.
Simulated example
If 240 of 400 independent readings belong to a category, p̂=0.60. The approximate symmetric margin is 4.80 points at 95% and 6.31 at 99%. The intervals are about 55.20–64.80% and 53.69–66.31%. These illustrate Wald intervals; Wilson generally avoids some weaknesses, particularly with small samples or extreme proportions.
An interval does not establish whether a category is useful, safe or avoidable. Break or documentation shares are not automatically recoverable losses.
Choosing a level
Use decision consequences, required precision, costs and explicit project requirements. There is no universal “95% industrial, 99% pharmaceutical” rule. Read applicable contracts or regulations; raising z does not ensure acceptance.
For before/after comparisons, calculate uncertainty in the difference. Separate-interval overlap is not the complete test, and causation requires consideration of relevant changes.
Application
Worksamp supports study parameters and documented advanced Wilson intervals. Separate visits and participations; people in one round may share conditions. Assess whether the application's calculation matches the implemented design. Do not claim guaranteed significance, audit approval or absence of bias.
Sources: NIST proportion intervals, NIST planning. See Worksamp for setup.