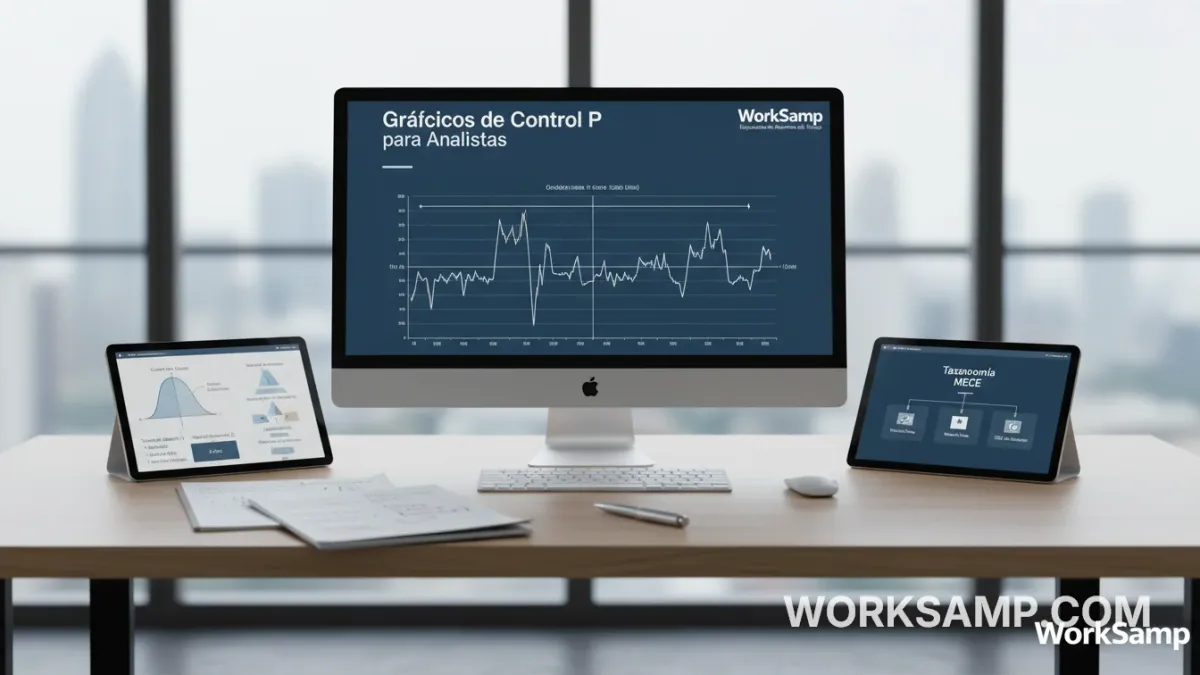
P-Charts (Control Charts) for Analysts
Interpret p-charts without confusing control limits, confidence intervals and guarantees of study validity.
WORKSAMP · LEARNING RESOURCES
Practical guides to design observations, interpret results and apply work sampling with clear assumptions.
Sample size, precision, confidence intervals and the limits of inference.
Explore guidesObservation plans, categories, routes and reliable data capture.
Explore guidesProportions, time, capacity and improvement decisions grounded in data.
Explore guidesExamples and limits in manufacturing, maintenance and services.
Explore guidesTools, organization and context for putting a study into practice.
Explore guidesShowing 85–92 of 92
Interpret p-charts without confusing control limits, confidence intervals and guarantees of study validity.
What offline capture offers and the limits of synchronisation, notifications and local data retention.
Perform instantaneous readings consistently without claiming they eliminate reactivity or observer bias.
Define time allowances, document their calculation basis and avoid counting rest or delays twice.
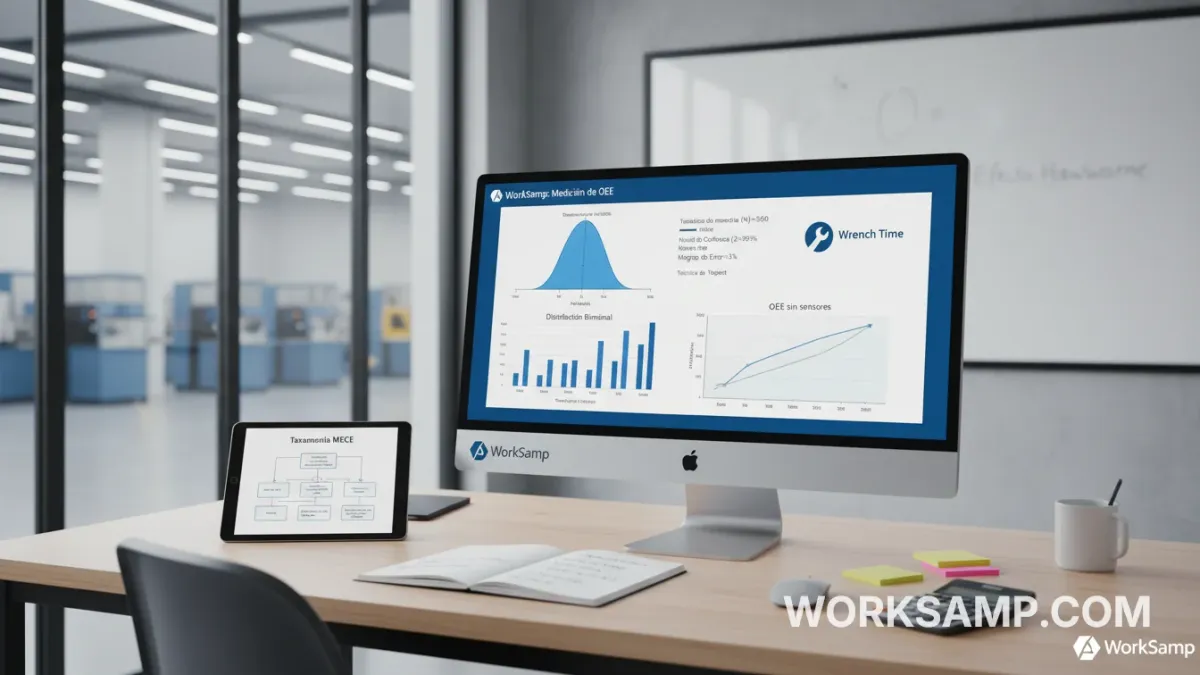
What sampling contributes to OEE analysis and the additional data needed for availability, performance and quality.
The binomial model in work sampling: observational units, assumptions, proportions and estimation uncertainty.
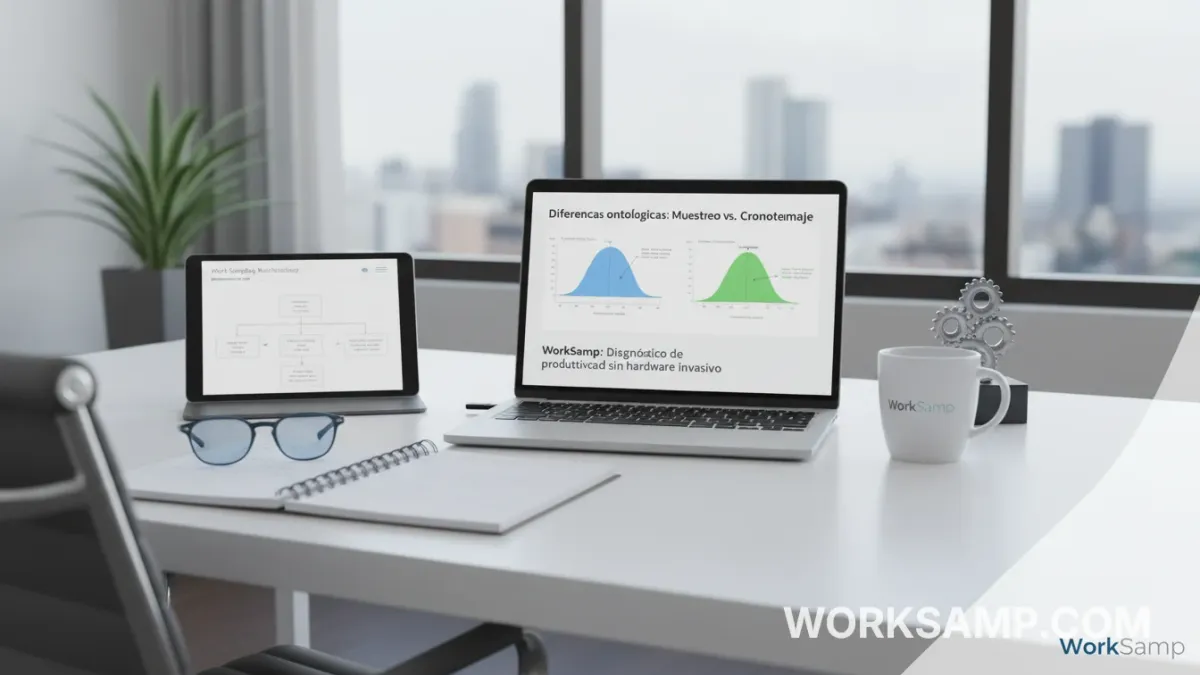
Differences between estimating activity proportions and measuring cycle times, and when to combine both methods.
What work sampling is, what it can estimate and the design and interpretation needed for a useful application.
Search covers all the guides in this collection, not just the current page.
Explore the app or ask about a demonstration using your context.
Explore WorkSamp →